Convexity Labs — a real-time options analytics terminal
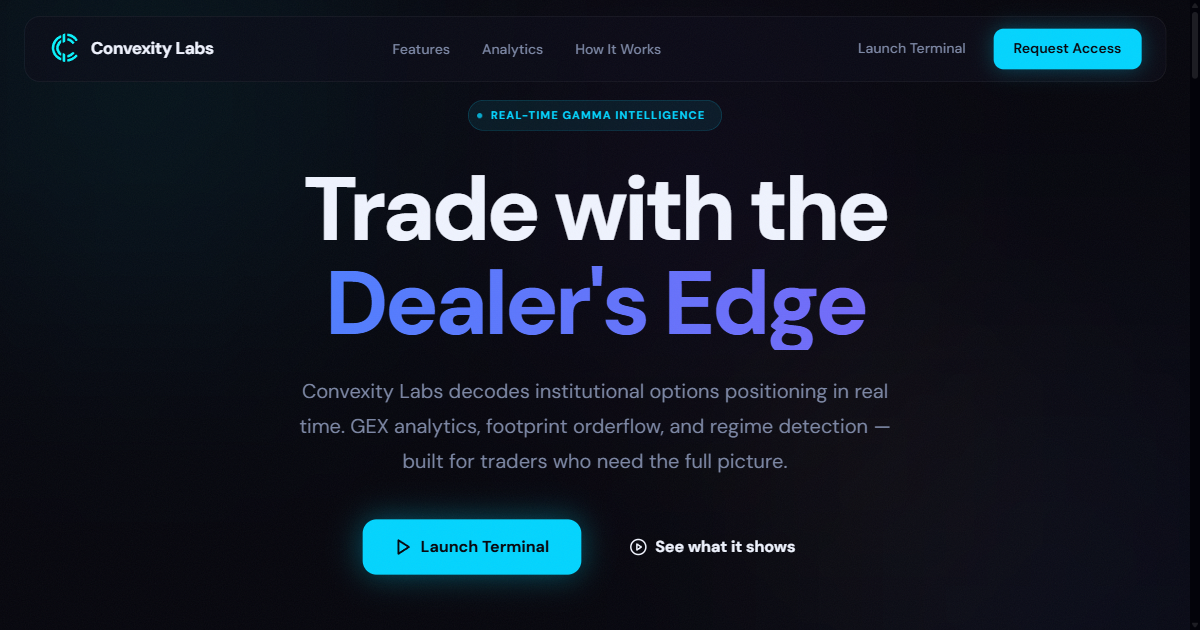
Convexity Labs shows options traders where dealers are positioned, in real time. I designed, built and run it alone: live market feeds in, gamma-exposure and order-flow analytics out, every trade archived — deployed on Oracle Cloud and live at convexitylabs.co.ke.
- Role
- Founder, sole engineer
- Stack
- Python · FastAPI · NumPy · Polars · Redis · PostgreSQL / TimescaleDB · React · Docker
- Data
- Deribit options chain · Binance L2 order book and trade stream
- Runs on
- Oracle Cloud Infrastructure (ARM) · tag-gated CI/CD
The problem
Market makers who sell options hedge by trading the underlying, and how much they must hedge depends on their gamma exposure (GEX). Where that exposure flips sign, price tends to either pin or accelerate. The inputs are public — the whole options chain and the live order book — but turning them into a view a trader can act on means recomputing Greeks across hundreds of contracts every few seconds and streaming the result without lag.
What it does
- Dealer positioning. Gamma exposure by strike, the gamma-flip level, vanna and charm, and dealer hedge levels, recomputed as the chain updates.
- Volatility surface. Implied volatility priced on Black-76 forward pricing, with skew analytics across expiries.
- Order flow. Level-2 order book, cumulative volume delta (CVD) and footprint candles built from Binance's aggregate-trade stream, shown as a depth ladder and book heatmap.
- Regime detection. Pin score, breakout probability and regime strength, surfaced on the trading desk.
- History. A tick-level trade tape, open-interest changes and every option trade with its taker side — a strong proxy for which side dealers took — archived to TimescaleDB for replay and research.
How it's built
Ingestion runs as separate processes — one for Deribit, one for Binance — that publish into Redis. A FastAPI service computes the analytics and broadcasts them to the browser over WebSockets, using a binary stream for order flow. A separate worker writes history to TimescaleDB through a write queue, so a slow disk never stalls the live feed. The front end is React with Zustand state and dockable panels that remember each trader's layout.
A backtest harness replays the archive with structural lookahead prevention: a strategy can only see data stamped before the moment it is deciding on, enforced by the replay engine rather than left to the strategy's author.
Making it fast
The first version of the analytics pipeline was plain Python loops. I rewrote the hot paths as
vectorised NumPy — broadcasting whole scans at once and aggregating with np.add.at —
and measured each change:
| Calculation | Before | After | Speedup |
|---|---|---|---|
| Gamma-flip finder (500-point scan × 735 contracts, one broadcast) | 2,895 ms | 288 ms | 10× |
| Gamma exposure aggregated by strike | 5.34 ms | 0.41 ms | 13× |
| Flip-finder normal-PDF step (SciPy replaced, scan reduced) | 254 ms | 30 ms | 8× |
| GEX slope (two scalar passes → one vectorised pass) | 7.8 ms | 2.4 ms | 3× |
Running it in production
- Deploys on a tag, not a merge. A self-hosted GitHub Actions runner on the production box builds native ARM images and deploys when a release tag is pushed; rollback is the same workflow aimed at the previous tag.
- Edge security. Caddy terminates TLS and adds security headers; Postgres and Redis are never published; an API key guards every route and both WebSockets.
- Accounts. Real user accounts with scrypt-hashed passwords and JWT sessions, with per-IP rate limits on the public endpoints.
- Operations. Memory ceilings on every container, a
/healthzendpoint that can actually fail, and migrations run as a gated one-shot service.
What it shows about how I work
I take a system from an empty repository to something people log into: data ingestion, numerical work, a real-time API, the interface, and the unglamorous production details — deploys, security, health checks. I measure before and after I optimise, and I write down why a hard-to-reverse decision was made.
Exactly how each number is computed, and where it can be wrong, is on the Convexity Labs methodology page.